
What’s the best plan to measure and analyze the performance of your game? One that’s ongoing and focused on funnel stages.
Funnels are commonly used in marketing but can be applied to any aspect of a business to represent the customer journey. They illustrate the stages potential customers go through from initial awareness to final purchase and beyond.
For mobile games, looking at specific metrics as they relate to funnel stages helps you dissect the player journey and gain insights into specific areas that need improvement. Think of it as an organized and granular approach that enables you to make targeted tweaks and optimizations at the most appropriate times.
By breaking down the player experience into distinct stages, funnels allow you to pinpoint exactly where users are dropping off and why. Imagine optimizing your messaging for specific cohorts — day 1 installs versus day 5, for example — to help engage better with players in different stages of your game.
Understanding how your game is performing through funnels gives you the information to make incremental changes that improve your game and player experience.
Let’s begin uncovering the different funnel stages and specific metrics that pertain to each stage. This will allow you to better understand where users are in their journey so you can look at the appropriate data to reduce churn, retain users, and scale your profits.
A quick note: For the purposes of this article, we’ve organized important metrics by funnel stage. However, the key metrics (e.g., effective cost per mille, conversion rate, average revenue per paying user) are fluid and not exclusive to these stages because monetization can happen at any stage of the user journey.
It’s important to look at your monetization performance numbers in tandem with user engagement, retention, and other stages of the funnel to ensure a strong user experience and profitability in your game.
Now, let’s jump in.
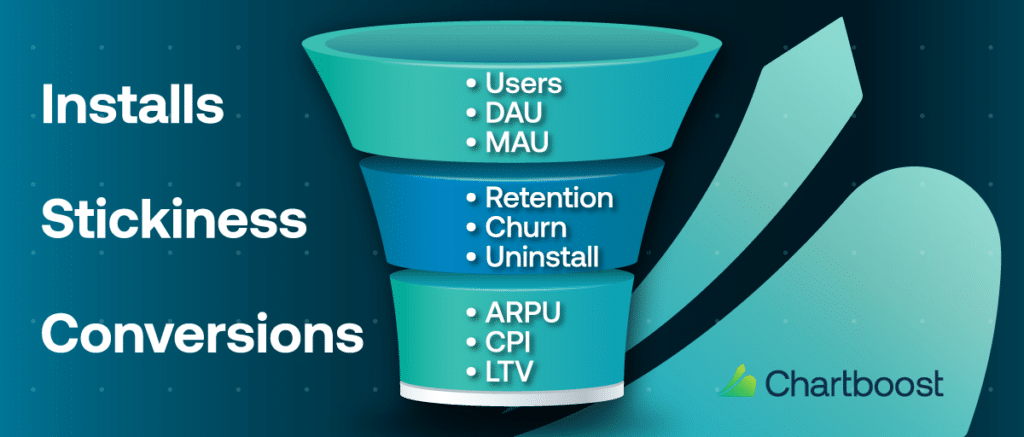
Top-of-funnel metrics
The very top-of-the-funnel stage helps you understand how users interact with your game from the beginning. Metrics in this stage provide insights into how users discover your game, whether they install it, and continue to play.
At this stage, you want to get as many users to install your game as possible (user acquisition). Once you’ve achieved an install, analyze user engagement to see the level of interaction and satisfaction players have with your mobile game.
Engagement metrics that look at players’ behaviors and activity levels include day 1 through day 30 retention, daily active users (DAU), and retention, which is the percentage of users who return to your game over time.
Other important metrics at this stage include:
- Installs: The number of times a game has been installed
- Users: This metric measures the number of unique players who engage with your game within a specific time frame; it is further divided into DAU and monthly active users (MAU)
- DAU: The number of players who engage with your game on a daily basis
- MAU: The number of players who play your game on a monthly basis
Top-of-funnel metrics measure your users’ behaviors and activity levels so that you can assess the overall appeal of your game.
Next, let’s examine mid-funnel metrics.
Mid-funnel metrics
When you reach this section of the funnel, you’ve already captured users and gained a better understanding of how they are interacting with your game.
Mid-funnel metrics look at where users are dropping off, and how to better retain them. Studies reveal that over 50% of app users will abandon an app in the first 30 days. Use this as a benchmark when coming up with your retention strategy, which is an important metric to assess in the mid-funnel stage.
Mid-funnel metrics dig into the why. Specifically, what is happening that is causing users to churn?
Perhaps you notice a dip in uninstalls shortly after users log in the first few times, which could indicate a need to strengthen your onboarding experience. In this case, think of ways to decrease friction and confusion by showing users how to get started in your game more clearly. Perhaps offer tutorials and point out specific parts of the game that are important.
You could also segment users by retention dates and develop specific messaging strategies.
For example, your messages to those who drop off on day 1 might differ from those who do so on day 7. If certain parts of your game are too challenging, you might offer a free weapon or a way for users to get ahead to the next level.
Metrics in this stage include:
- Stickiness rate: The percentage of users who return to the game after their first session
- Retention rate (RR): The percentage of users who continue to play the game after a certain period of time
- Churn rate (CR): The percentage of users who stop playing the game after a certain period of time
- Uninstalls: This metric measures how many users uninstall your mobile game completely; a high number of uninstalls indicates that your game is not meeting the expectations of players
Keep in mind that churn is normal for any mobile game and users may wait to return after installing a game. It may be a day or two (or several) later.
Bottom-funnel metrics
Bottom-of-the-funnel or down-funnel metrics measure the effectiveness in driving in-app purchases, generating revenue, and creating player loyalty.
In this stage, you want to evaluate how well users are converting and how much they are likely to spend.
To accomplish this, track metrics that are tied to how much you’re earning per user and what it costs to acquire a new user. With this data, you can better predict profits and spend.
You’ll give yourself the greatest chance of success if you know how much to spend on marketing versus how much you think you’ll make. Drawing this distinction in your budget helps you optimize your ROI as well as the cost of acquiring a user and the lifetime value of that user.
Some key metrics to consider here are:
- Conversion rate: The percentage of users who make an in-app purchase or complete another desired action; a high conversion rate indicates that your game is effective in driving user engagement and monetization
- Average revenue per user (ARPU): The average amount of revenue generated per user
- Cost per install (CPI): The cost of acquiring a new user through advertising
- Lifetime value (LTV): The total amount of revenue generated by a user over his or her lifetime
These metrics give you the information you need to determine the ROI of a specific ad campaign and adjust your spend accordingly.
Tips for measuring and analyzing performance
By tracking and analyzing funnel metrics, you will begin to see a more comprehensive overview of your game’s performance and how users move through your game.
In summary, to help strengthen your game’s overall performance:
- Figure out why users leave your game and what makes them return
- Re-activate churned users using tailored messaging, such as push notifications
- Find and optimize the channels that gain the most engagement from users
- Segment and target users by pinpointing where they are in the funnel
To track these metrics effectively, take advantage of funnel reporting tools, which you may already have in your analytics platform. These reports help you visualize and measure how users move through a sequence of events.
A well-designed funnel gives insight into which events lose the most users, whether your paths to conversion are optimized, and if users are progressing through your game as intended.
Need help measuring and analyzing your funnel? Contact us and will be happy to help maximize your monetization strategies.